
The “New International Division of Labour” is a term in economics used to describe the evolving structure of economic geography in the 1970s, produced by the globalization of firms. It suggests that global firms will opt to locate key functions (often industry-related, such as HQ, R&D) in wealthier countries with stronger talent pools, while leaving their ancillary services (often production, e.g. manufacturing) in less developed countries with a wider pool of low-wage workers.
Nonetheless, with the proliferation of low-wage service workers and upskilling of manufacturing tasks due to technological advancements, this observation may no longer hold as relevant today. This project hence aims to explore the various world economies by their dominant sectors (measured by Value Add % of GDP), via cluster analysis.
Results - Hierarchical Clustering
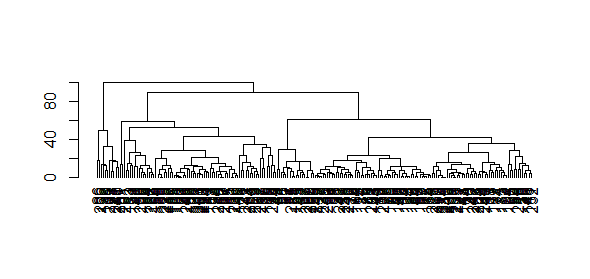
A dendogram was first plotted to explore clustering options.Based on the diagram, it was decided that 3 clusters will be selected, as this made the longest difference in distance.
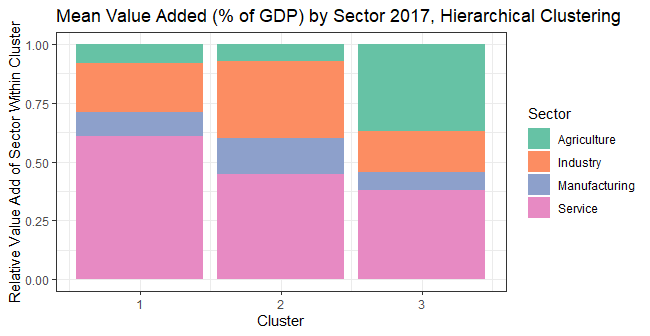
The results from hierarchical clustering interestingly correspond to the expectations of today’s “less developed” (cluster 3), “emerging” (cluster 1) and “developed” (cluster 2) economies. The “less developed” cluster (#3) has countries where agriculture and service form a large part of the economy. In contrast, the “developed” cluster (#2) has a large GDP value-add from industry sector, with relatively less from agriculture. Interestingly, the “emerging” cluster (#1) had the highest contribution from the service sector while low contribution from the agriculture sector; this mirrors the nature of many emerging economies, particular those in Asia, where middle-skilled works increasingly engage in sectors like tourism or retail.
Results - Kmeans Clustering
Elbow and Sihoulette plots were created to analyse the number of clusters that should be used for k-means clustering as well.
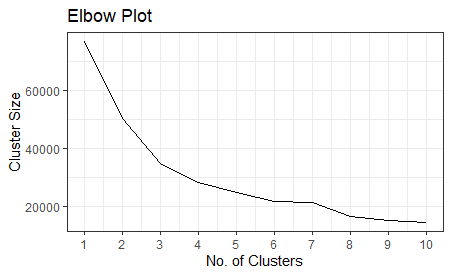
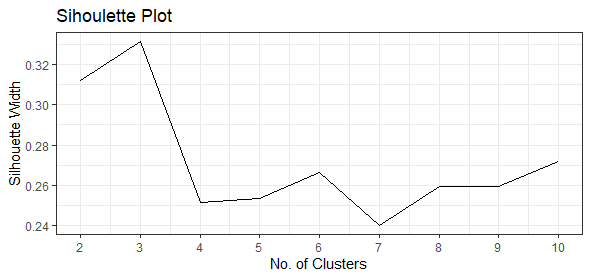
Interestingly, both the Elbow and Sihoulette plots suggest that 3 is an appropriate number of clusters.
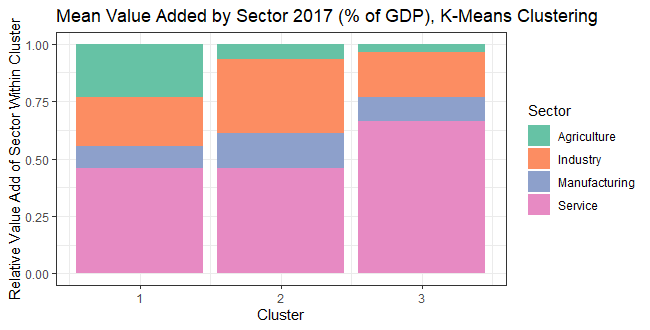
The results from K-means clustering are indeed similar to that from hierarchical clustering; clusters can be roughly described as “less developed” (cluster 1), “emerging” (cluster 3) and “developed” (cluster 2). Interestingly, the observations from hierarchical clustering are applicable here as well, e.g. the relative proportions of the “emerging” cluster are similar, with service being the largest, but industry being roughly similar in proportion to the “less developed” cluster.
Data Information
This project used World Bank data on the Value Added (% of GDP) dataset for the (1) Agriculture, Forestry and Mining, (2) Industry (including Construction), (3) Manufacturing, (4) Service datasets. The data used was from 2017 and only included complete cases (208 of 264). Missing data was not replaced as it is likely that data was missing not at random, but rather due to governmental stances on data reporting.
The relevant Github repo for this can be found here.